Pivot › Shortcuts › New Report / Custom Report
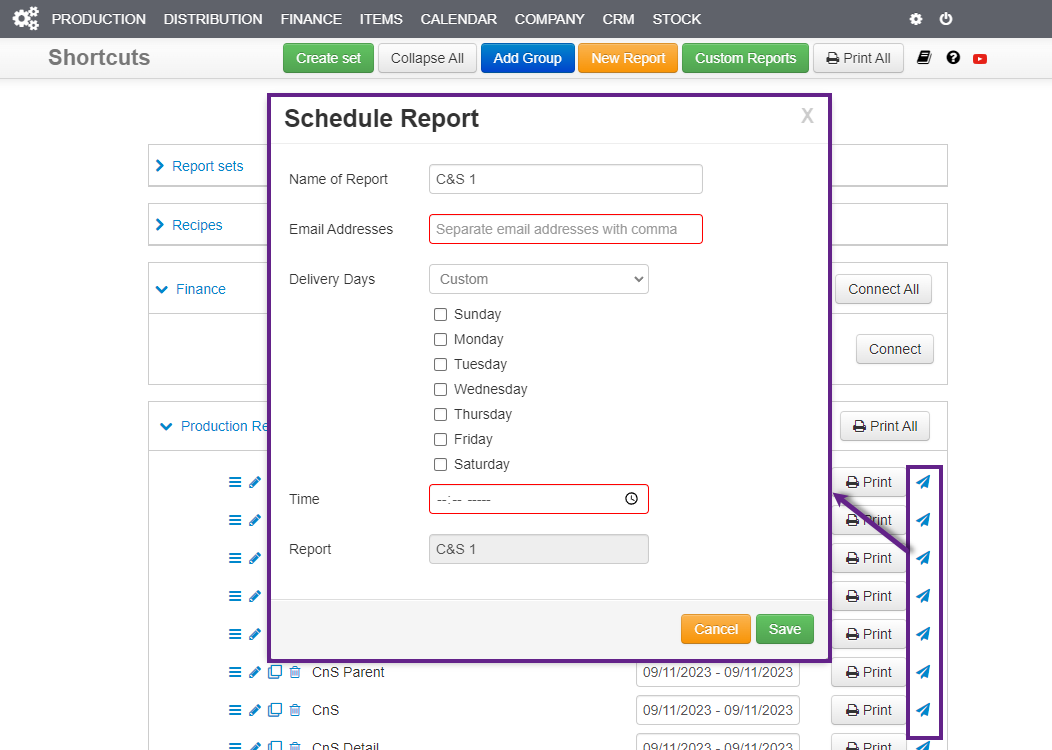
Create a new report or customize an existing report. And you may preview while you’re doing it. We save all your reports in shortcuts: your packing slips, your invoices, driver reports, et cetera.
All the production reports can be seen here: the Cut & Shape, and the Slicing Report. Create a schedule, and that goes on the relevant days of the week to the baker at a given time.
Cut & Shape (C&S) vs Goods in Progress (GiP) #
Production › Cut & Shape › Production/Distribution Date
C&S is grouped by Distribution Date, whereas GiP is grouped by Production Date. Therefore, C&S displays items that are being delivered on the given date(s), whereas GiP displays items that begin production on the given date, regardless of the date of delivery.
Typically, users opt for C&S and use Recipes by Production Date, as the information needed to begin production is the Recipe.
Creating reports in Cut & Shape #
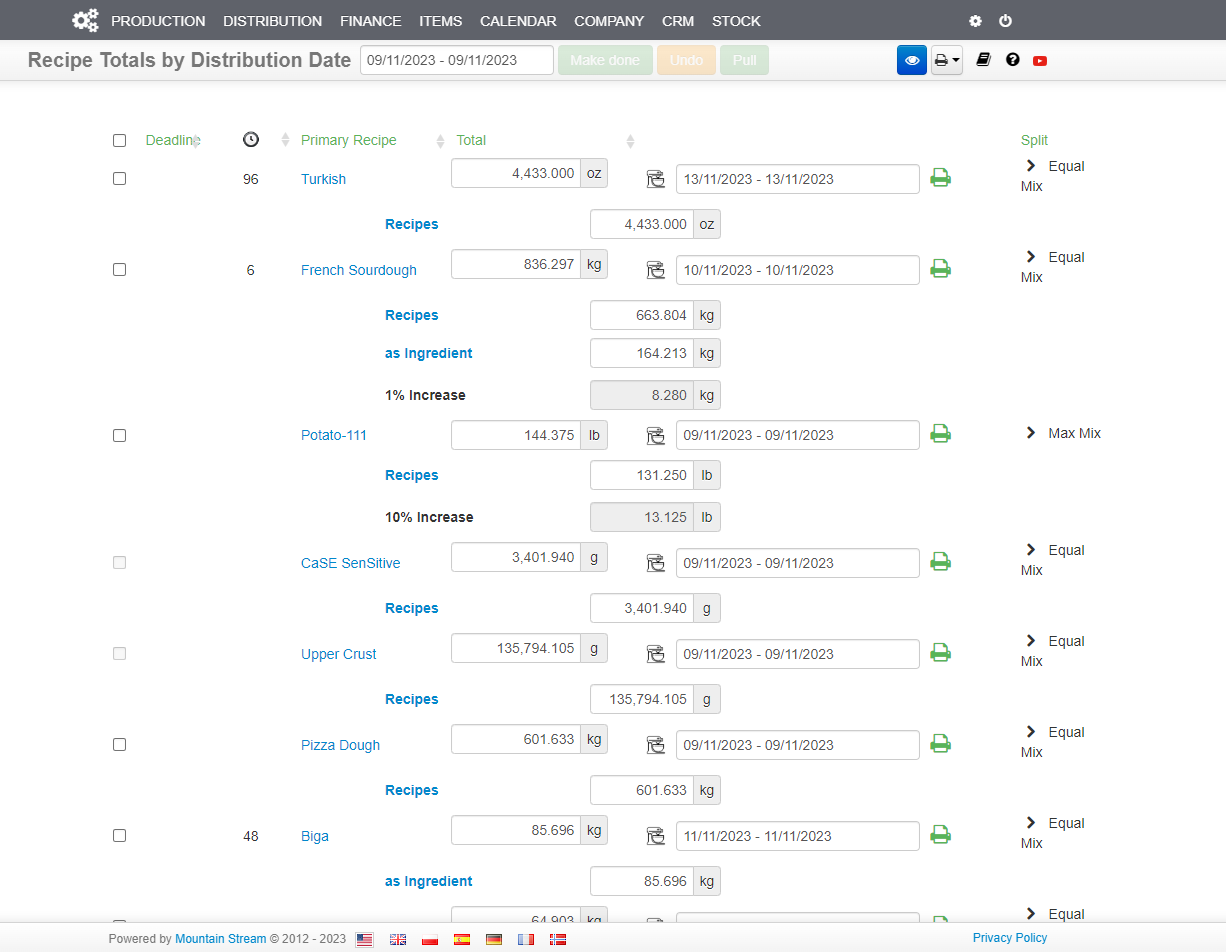
1. Bakers start with Recipe Totals either by distribution or production date:
- If you have the same lead times on all your items, the distribution and production dates are going to have exactly the same items on them.
- You can make changes on the fly and recipes are included in the print run. For example, let’s say that they wanted to make instead of 4,433.000 of Turkish, they wanted to make 5,000.000; you could set it manually in the ‘Total’ column. Then when you generate the recipe for that one, it will be for a 5,000.000-oz mix.
- You can get a daily summary that will open up in a new tab, or I can print out what we call a Recipe Card per recipe.
NB: The order that you stipulate in the Recipe Book will dictate the order of the Recipe Totals over here.
2. The Cut & Shape Production › Cut & Shape › Distribution Date report shows the bakers what and how much they are mixing each recipe. This is done by parent item, meaning that it’s consolidating all the sliced items with the unsliced.
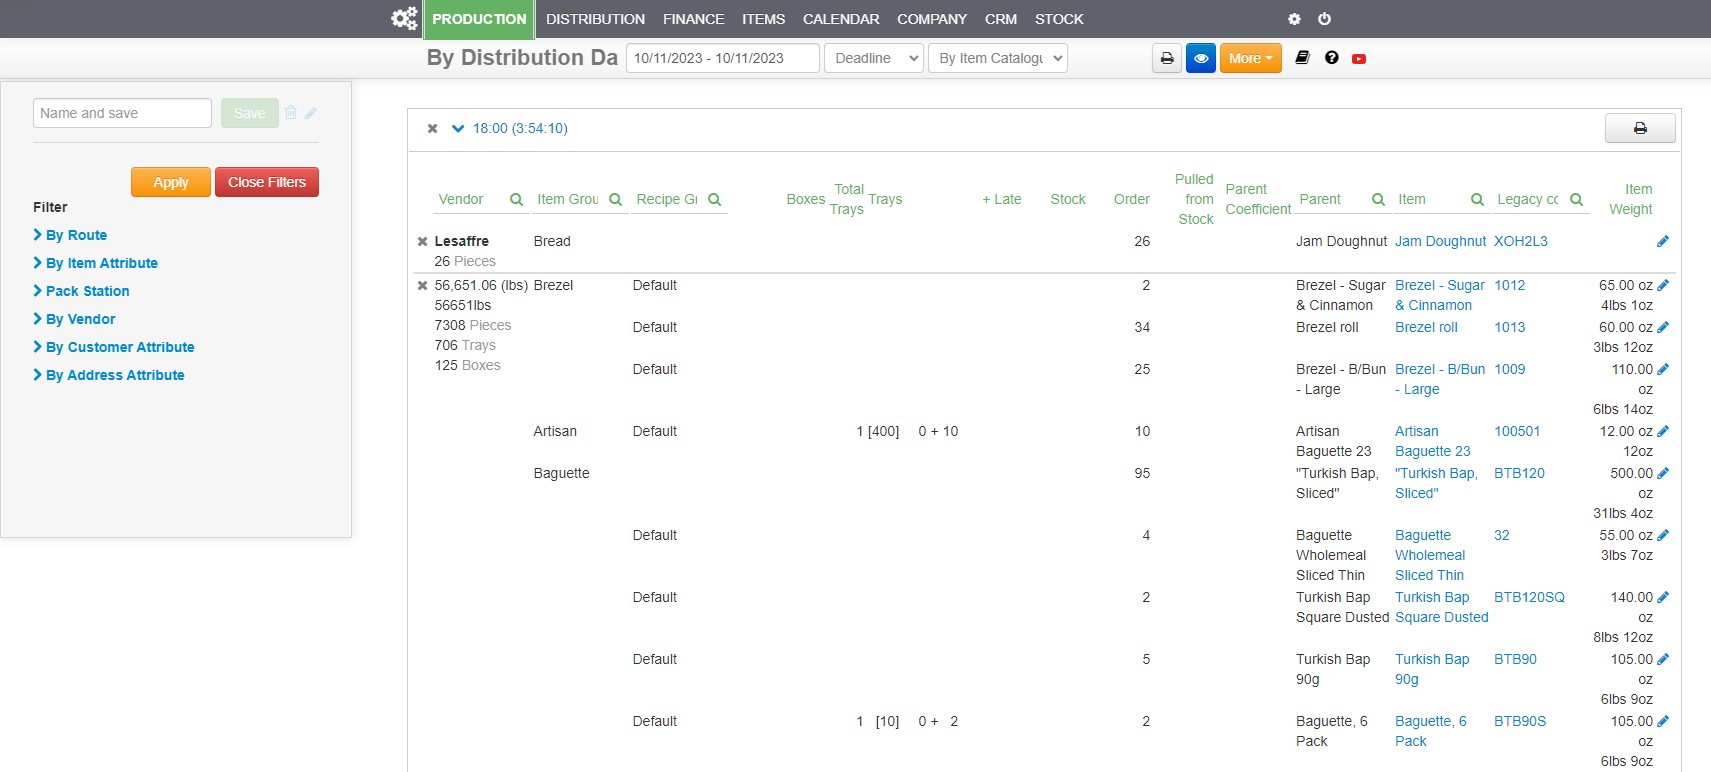
The report tells us how to structure the data (columns) and the values for those columns. The view can also be edited in the “Eye” icon on the right and control what you want to show in the report.
Also, create a shortcut with the wanted view settings and organize it by the order you like it, go to Shortcuts to edit it further.
NB: As orders are entered in the system, reports update. Remember to refresh the report!
3. The Master Item Catalogue Item › Master Catalogue › Batch Edit has unlimited columns/attributes, use the values within a column for pivoting, grouping, and filtering reports; you can drag and organize it however you want.
All the item attributes/columns can be filtered in the Item Catalogue, you can apply to reports that give you the option of organizing by the order of the Item Catalogue.


