Table of Contents
Menu Engineering Chart (Stars, Cash Cows, Workhorses, Dogs) #
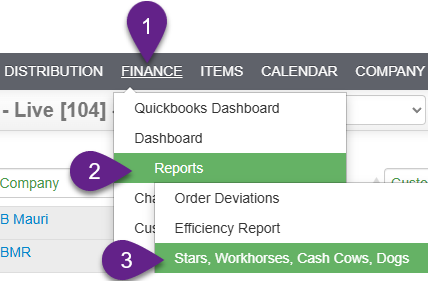
Finance › Reports › Stars, Cash Cows, Workhorses, Dogs.
Analyzes each menu item based on two key metrics: gross margin (profitability) and sales volume (popularity). Based on this analysis, every item is placed into one of four categories, allowing you to make strategic decisions about your menu, pricing, and marketing.
Overview #

- Graph shows the data on the specific date range:
- Hover on the point to show data.
- Click the point to filter data below the point. Release filter, top right.
- Summary of the data:
- Click specific Quadrant Distribution section for more information
- All Data:
- Click header names to filter
- Pivot Mode Filter


