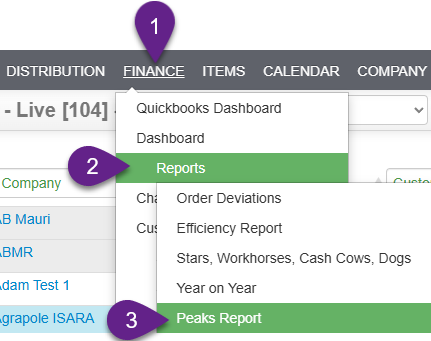
Finance › Reports › Peaks Report.
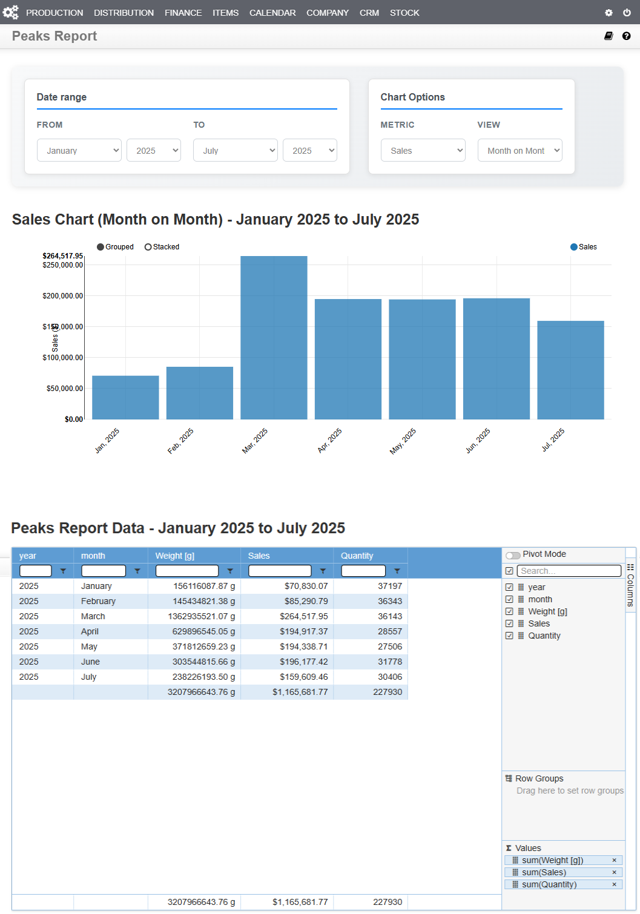
Visual analysis tool that aggregates key business metrics. Help you identify your business’s seasonal peaks and troughs, allowing you to make informed decisions about inventory, staffing, and marketing based on performance trends.


Chart option #
Metric
- Sales.
- Weight [g].
- Quantity.
View
- Month on month.
- Year on year.
- Annual.
Sales Chart – Data from the selected date and chart filter.
Peaks Report Data – Consists of all Data.
